Installation
GoldenViz is available as a Python package. The recommended way to install it
is with pip in a project-specific virtual environment.
Install from PyPI
pip install GoldenViz
After installation, import the library with the same capitalization:
import GoldenViz as gv
Check your installation
Run this small example to confirm that GoldenViz can inspect a Matplotlib figure:
import matplotlib.pyplot as plt
import GoldenViz as gv

fig, ax = plt.subplots()
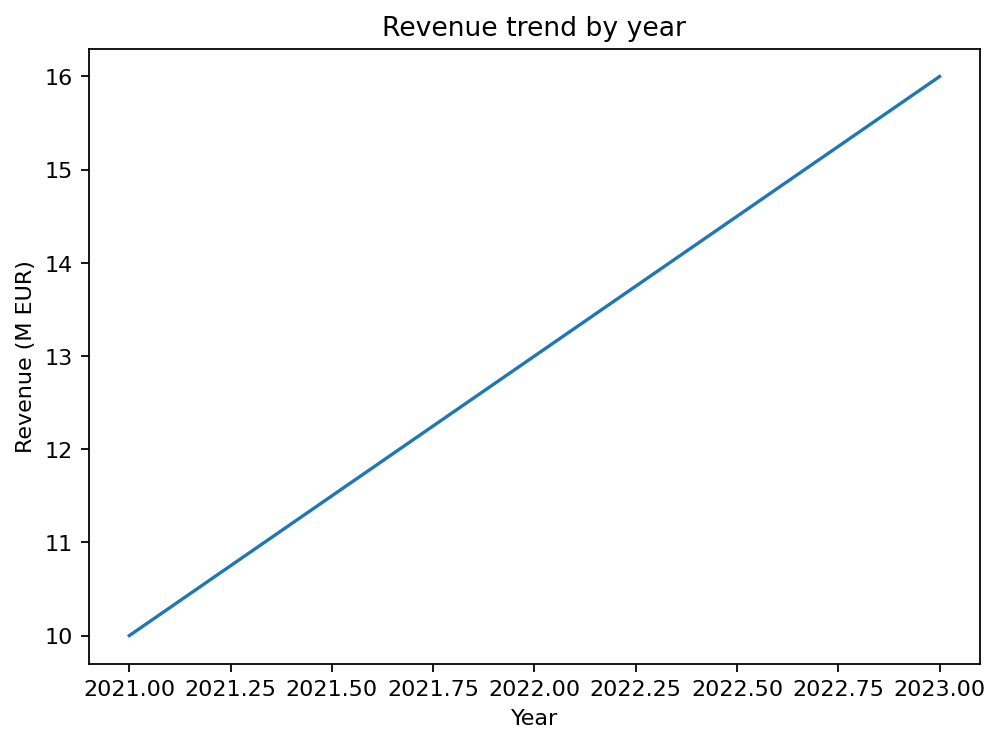
ax.plot([2021, 2022, 2023], [10, 13, 16])
ax.set_title("Revenue trend by year")
ax.set_xlabel("Year")
ax.set_ylabel("Revenue (M EUR)")

gv.check(fig)
After running the code, you should see two outputs: first the Matplotlib chart, then the GoldenViz report.
Expected chart output:
Expected GoldenViz report output:
View warnings and failures
Passing checks (25)
| Rule | Status | Assessment |
|---|---|---|
| Clear title | PASS |
Title detected: 'Revenue trend by year'.
|
| Axis labels | PASS |
Both x-axis and y-axis labels are present.
|
| Units and scale clarity | PASS |
Numeric labels include detectable units or scale where applicable.
|
| Legend clarity | PASS |
No obvious legend clarity issue detected.
|
| Annotation context | PASS |
No obvious annotation context issue detected.
Revenue trend by year
|
| Uncertainty cues | PASS |
No uncertainty cue issue detected.
Revenue trend by year
|
| Readable labels and ticks | PASS |
No obvious readability issue detected.
|
| Color accessibility | PASS |
No obvious color accessibility issue detected.
|
| Direct labeling | PASS |
No direct-labeling opportunity detected.
|
| Avoid chartjunk | PASS |
No obvious chartjunk issue detected.
Revenue trend by year
|
| Too many categories | PASS |
Category count appears manageable.
Revenue trend by year
|
| Sort categorical bars | PASS |
No categorical bar sorting issue detected.
Revenue trend by year
|
| Scatter overplotting | PASS |
No scatter overplotting issue detected.
Revenue trend by year
|
| Decimal precision | PASS |
Tick precision appears readable.
Revenue trend by year
|
| Date axis formatting | PASS |
No obvious date-axis formatting issue detected.
Revenue trend by year
|
| Visual economy | PASS |
Chart appears visually economical.
Revenue trend by year
|
| Appropriate scale | PASS |
No obvious scale issue detected.
|
| Chart type | PASS |
Detected chart type: line.
|
| Color map quality | PASS |
No problematic color map detected.
|
| Avoid dual axes | PASS |
No dual-axis layout detected.
Revenue trend by year
|
| Area baseline | PASS |
No area baseline issue detected.
Revenue trend by year
|
| Aspect ratio sanity | PASS |
Figure aspect ratio appears reasonable.
Revenue trend by year
|
| Histogram bin quality | PASS |
No histogram bin issue detected.
Revenue trend by year
|
| Category color consistency | PASS |
No category color issue detected.
Revenue trend by year
|
| Diverging zero reference | PASS |
No diverging zero-reference issue detected.
Revenue trend by year
|
Notebook users
GoldenViz works well in Jupyter notebooks and VS Code notebooks. For the best
notebook experience, make sure ipykernel is installed in the same
environment:
pip install ipykernel
Then enable automatic chart checks inside a notebook:
import GoldenViz as gv

gv.auto()
Development install
If you are contributing to GoldenViz or working from a local checkout, install the project in editable mode:
pip install -e .
Documentation dependencies:
pip install -e ".[docs]"
Test dependencies:
pip install -e ".[test]"